

Chelsea Newhouse
Senior Program Manager, East-West Management Institute
Research Consultant, George Mason University Nonprofit Employment Data Project
Diving into Nonprofit Wage Competitiveness
Nonprofits have struggled to recover jobs lost during the first years of the COVID-19 pandemic, and are now grappling with a well-documented workforce crisis — leading to burnout, turnover, and declining morale among the people who make it possible for organizations to carry out their missions. It is therefore important to have a clear understanding of how nonprofit wages stack up against wages in the for-profit and government sectors, and what gaps need to close to support nonprofits in recruiting and retaining workers.
Spotlight on Nonprofit Wages, George Mason University – Nonprofit Employment Data Project’s new report co-authored by GMU’s Center on Nonprofits, Philanthropy, and Social Enterprise Director Alan Abramson, sheds light on the overall competitiveness between sectors and digs into field-level comparisons. What we found was a complex story, impacted by the industries that are the largest employers in each sector.
Key Findings
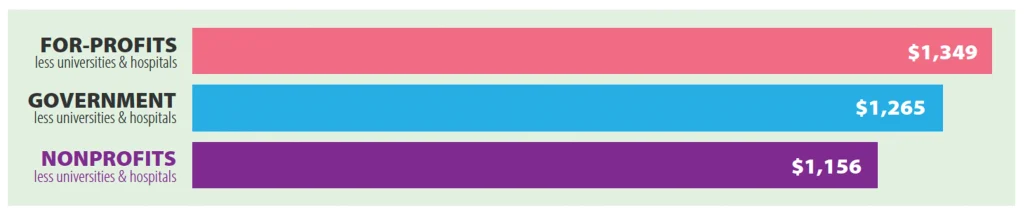
Charitable nonprofit workers in the U.S. are, overall, paid wages that put them roughly on a par with workers in both for-profit businesses and government institutions. However, the story is complicated by the fact that, unlike the other two sectors, nonprofits are highly concentrated in a handful of fields and wages vary widely between highly paid fields like health care and education and traditionally lower-wage fields like social assistance and the arts. In particular, when the largest nonprofit institutions — hospitals and higher education institutions — are excluded from the analysis in all three sectors, average weekly wages for nonprofit workers were 9% lower than government workers and 14% lower than for-profit workers in 2022.
Average weekly nonprofit, for-profit, and government wages, less hospitals and higher education institutions, 2022
Over 91% of all nonprofit workers serve organizations in just five fields — health care; education; social services; arts, entertainment, and recreation; and religious, civic, grantmaking, professional and similar organizations. As such, the overall comparison only tells us so much about whether nonprofits are offering competitive wages to workers in the same roles in other sectors. The picture that emerges is complicated.
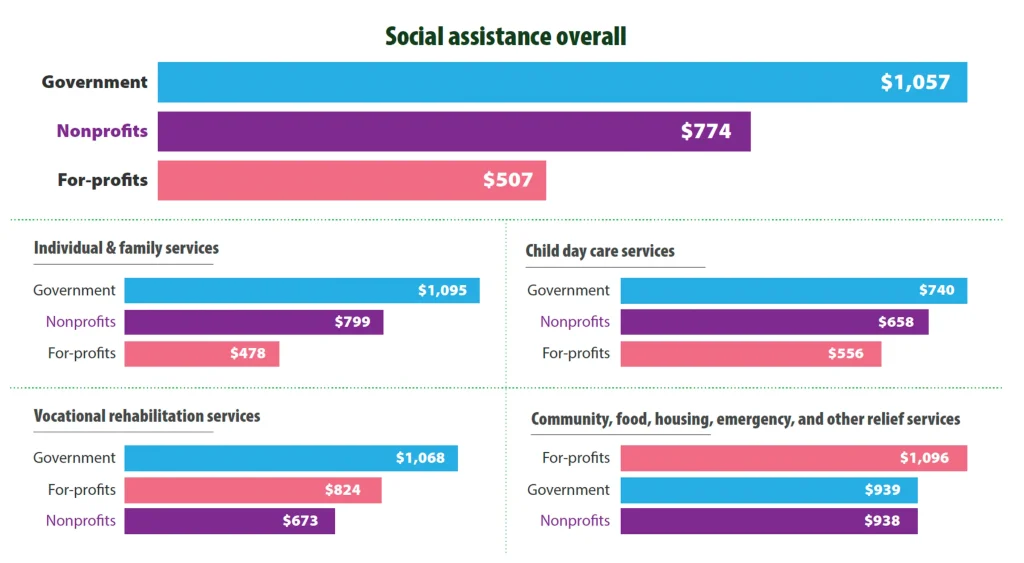
In the social assistance sector for example — where a recent Independent Sector and United for ALICE report found that a high concentration of nonprofit workers fell below the ALICE threshold for livable wages — nonprofit organizations paid 27% ($283/week or $14,731/year) less then government agencies while at the same time paying 53% ($267/week or $13,889/year) more than for-profit social assistance businesses.
Average weekly wages in social assistance sub-sectors, 2022
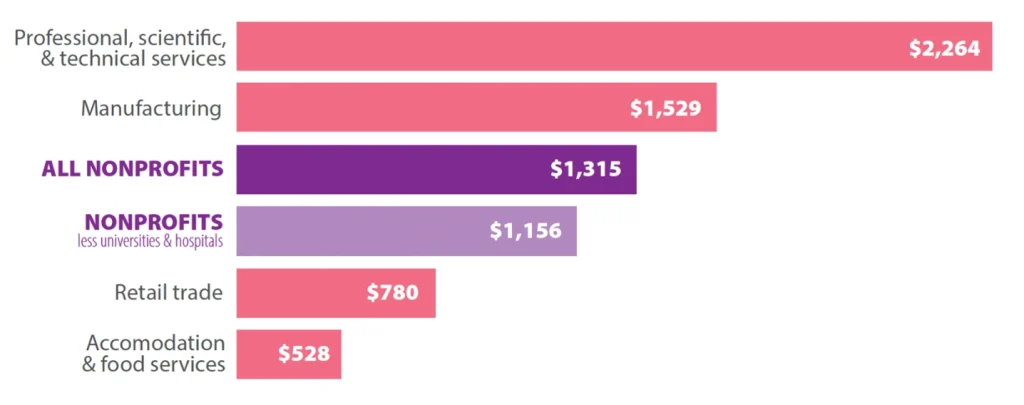
There are four for-profit dominated industries that employ comparable numbers of workers as the nonprofit sector’s 12.8 million-strong workforce — retail trade (15.4 million); accommodation and food services (13.4 million); manufacturing (12.8 million); and professional, scientific, and technical services (10.2 million). When compared to these industries, nonprofit wages — both with and without hospitals and higher education institutions included — fall in the middle. This demonstrates the impact of wage variations among industries.
FIGURE 3: Average weekly nonprofit wages vs. wages in four largest for-profit industries, 2022
Implications for nonprofits
When we compared average wages paid by nonprofits on the field level, we found that wages in two of the main nonprofit fields — social assistance and the arts — fell below wages paid to retail trade workers. However, this is not only a nonprofit problem. In particular, when compared to wages in these other industries, employees of for-profit social assistance workers were paid just $507/week — less than even workers in accommodation and food services, the lowest-paying major industry.
As such, nonprofit wages may be low not because nonprofits choose to pay their workers less than other sectors, but because several of the fields in which nonprofits operate have workers (from all sectors) who have historically received low wages.
In addition to the report discussed here, nonprofit leaders — and those considering employment in different sectors — who are interested in detailed, cross-sector comparative wage data can also consult the GMU Nonprofit Works website for localized and historical data.
This article is one of many resources dedicated to strengthening the nonprofit sector. Please be sure to check out NCNE’s website and LinkedIn page to connect with other nonprofit leaders and support on making wise decisions in nonprofit leadership.
